Phylogenetic Trees, Cladograms, and How to Read Them
Scientists have identified and described about 2.16 million species so far—figuring out how those species are related to each other is a huge challenge. To examine relationships between species and other groups of organisms, we visualize them through cladograms and phylogenetic trees. These tools are like family trees that represent modern-day organisms, their ancestors, and the probable relationships between them.
 The interactive phylogenetic tree model in Visible Body Suite makes it easy to see the relationships between taxa.
What’s the difference between a cladogram and a phylogenetic tree?
As if biology wasn’t complicated enough, many scientists use the terms cladogram and phylogenetic tree interchangeably. Cladograms and phylogenetic trees are both branching diagrams that represent relationships between taxa (singular taxon), which are groups or ranks of organisms. Cladograms and phylogenetic trees are functionally very similar, but they show different things. Cladograms do not indicate time or the amount of difference between groups, whereas phylogenetic trees often indicate time spans between branching points.

Phylogenetic trees and cladograms are branching diagrams. Lower right cladogram from Wikipedia Commons.
A cladogram illustrates hypothetical relationships between species based on traits. It’s called a cladogram because a group of related organisms (including living organisms and their common ancestors) is called a clade. Cladograms do not describe the process of evolution, and they don’t reflect the amount of difference between groups. Cladograms may be based on physical traits, genetic data such as DNA sequencing or, more often, a combination of both.
A phylogenetic tree can also be created using genetics and physical characteristics. It’s worth noting that DNA doesn’t tell us exactly how species are related to each other, only that they are related. For some phylogenetic trees, the branch lengths represent time—these are technically called phylograms—whereas cladograms do not represent evolutionary time.
Both kinds of trees are constantly being updated as we learn more about the genetic makeup of different organisms. For the rest of the blog post, we’ll use the term phylogenetic tree when describing the different parts of the diagram and how to read it, but know that these terms also apply to cladograms.
The parts of a phylogenetic tree
A phylogenetic tree is made up of several branches—it’s called a tree for a reason! Each branch represents a lineage, and the tips of the branches represent the taxa being examined. Taxa are groups of organisms.

The phylogenetic tree model in Visible Body Suite.
Branches are connected to other branches by nodes, also known as branch points. A branch point represents the divergence of two species, and the two species’ most recent common ancestor is represented by the branch point. Sister taxa is the term that describes two lineages that come from the same branch point, or node.
A rooted phylogenetic tree shows the common ancestor of all species in the tree while an unrooted phylogenetic tree does not. A basal taxon is a lineage that does not branch again after it branches from the root.
A polytomy is a branch of more than two species. Polytomies appear when we don’t have enough information to determine branch placement.

How to read a phylogenetic tree
Each branch of the tree represents speciation, or the formation of new species. The new lineages have different characteristics than the species before them. When looking at a phylogenetic tree, you’ll notice that one side has the tips of the branches with the taxa labeled. This side represents the present and the opposite side represents the past.
Here is a pro tip: the order of the species on the tips of the branches doesn’t mean anything. In fact, you can flip the tree at the branch points and it does not change the meaning of the tree!
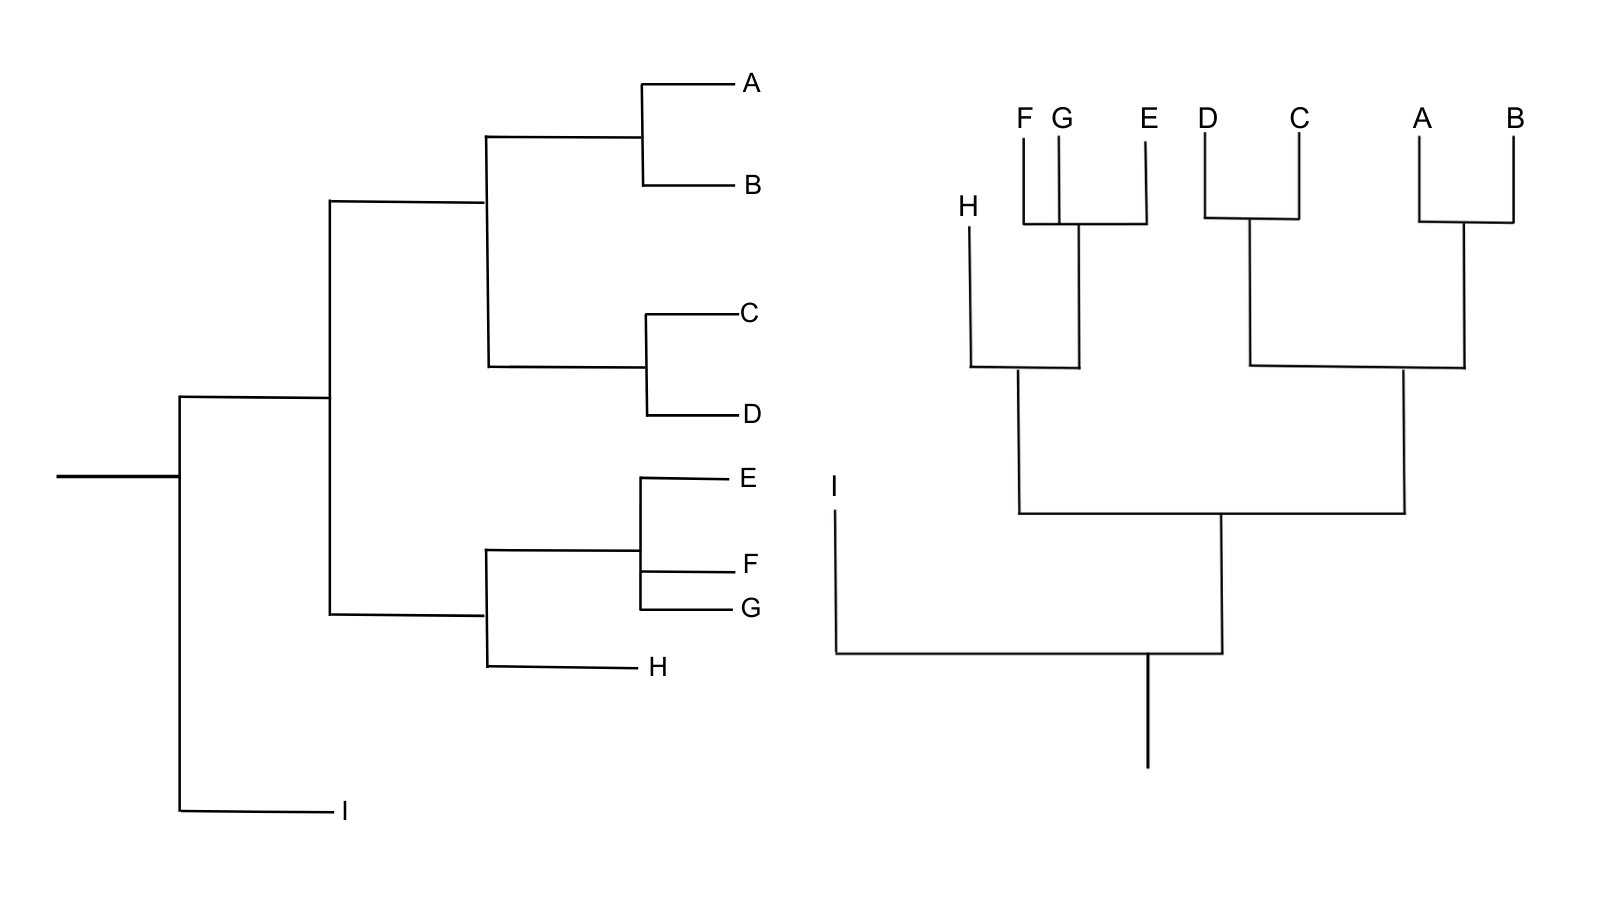
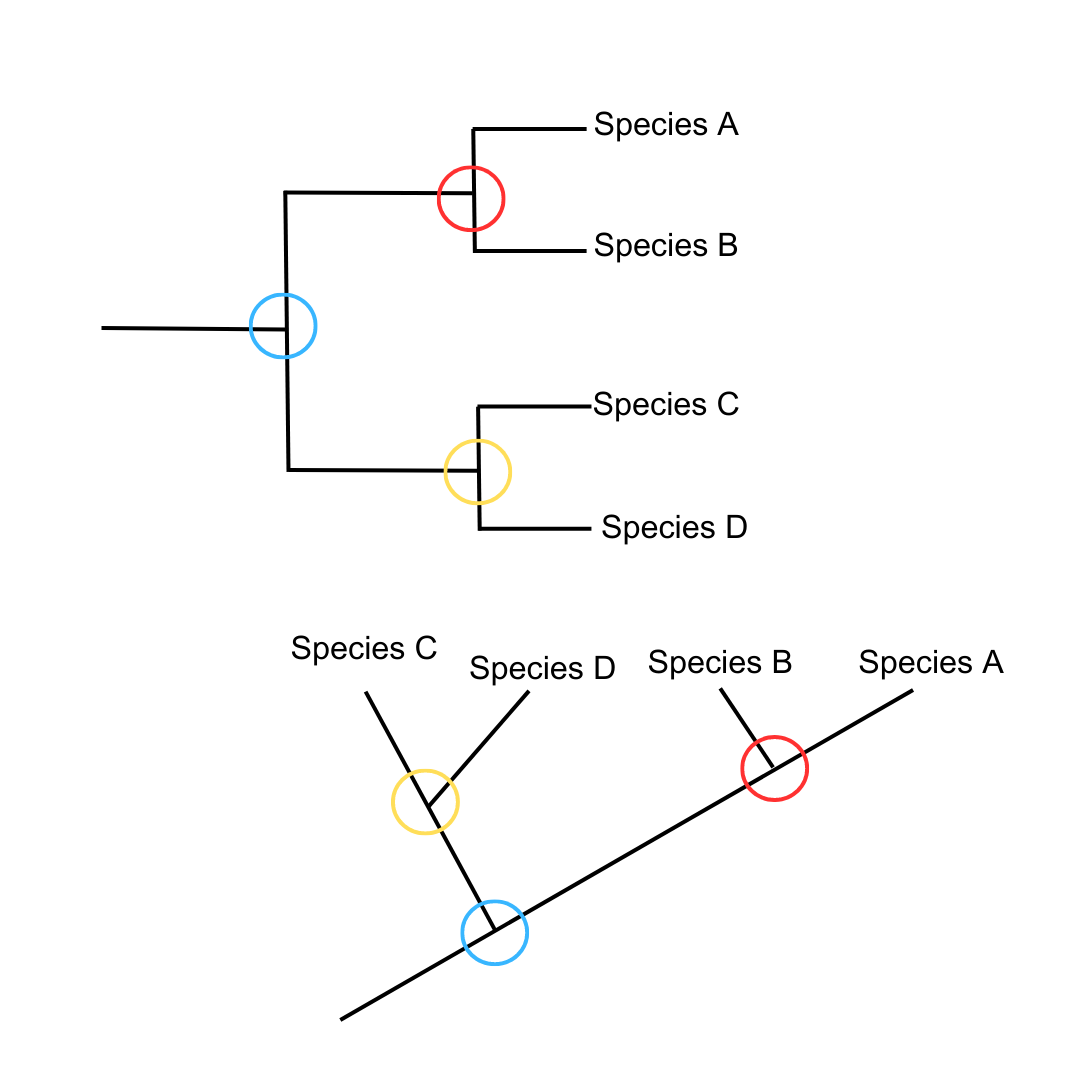
Phylogenetic trees also come in different shapes. For example, look at the two trees below.

These two trees deliver the same information in different ways. Take a closer look at the branch points and you will see that the two trees show the same relationships between taxa.
You can determine which species are more closely related by looking at the most recent common ancestors. Look at the phylogenetic tree below and remember that each branch point (circled in different colors) represents a common ancestor.
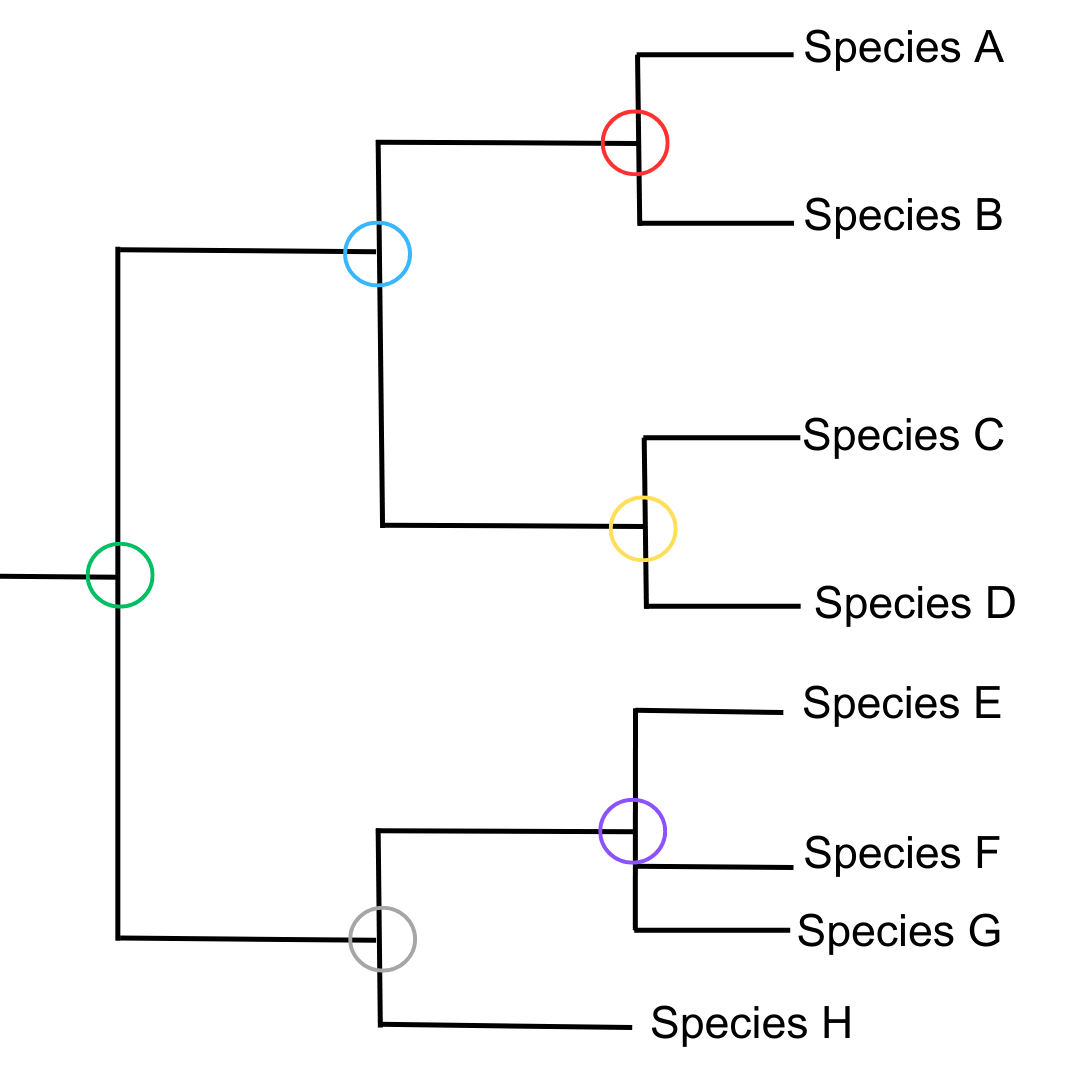
Species A and Species B share a more recent common ancestor (red) than Species A and Species C (blue), which means that Species A and Species B are more closely related than Species A and Species C.
Conclusion
We hope that this has been a helpful introduction to the cladogram and phylogenetic tree!
Want to explore the interactive phylogenetic tree model? Check out Visible Body Suite! VB Suite's library of 3D models, animations, and study tools can put you (or your students!) on the path to success. You can also check out our phylogenetic tree lesson plan for ideas on how to use the model in the classroom.
Read more about evolution on the Learn Site and the Visible Body Blog:
- How do new species arise?
- Darwin's Finches Keep Evolving
- 6 Evolution Myths—Debunked!
- How—and Why—Do Humans Walk Upright?
Be sure to subscribe to the Visible Body Blog for more awesomeness!
Are you an instructor? We have award-winning 3D products and resources for your anatomy and physiology or biology course! Learn more here.

